Unity Object Pooling - Pt. 2
Experiment Results!

👋🏾 Hello! 👋🏾 My name is Esteban and I love video games and learning about making games. I'm sharing here my progress as I build up my skills and learn new technologies.
Context
In my last article, I showed you how about I set up a scene to test Unity's object pooling features, which added in version 2021. I also created a simple solution to allocate game objects with and without object pooling, in order to compare the 2 of them:
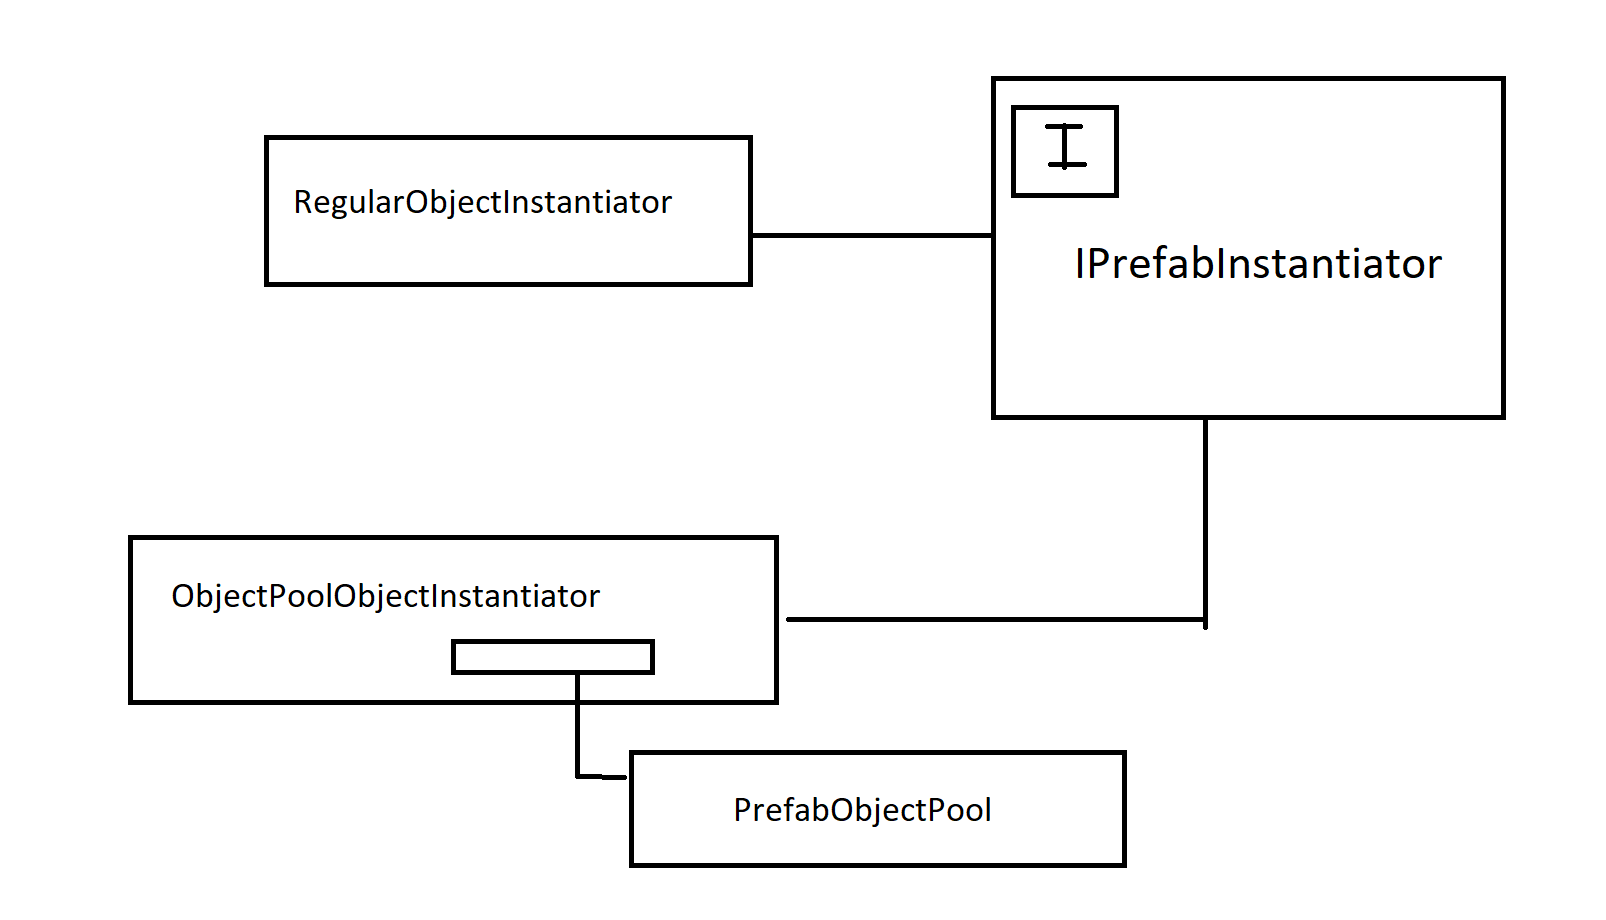
Yep, that's a class diagram created in good old MS Paint!😂 🎨
In this post I'll continue my experiment and keep testing with object pooling allocations versus regular allocations. I will also experiment with scene memory/resource usage analysis by using Unity's own performance profiler.
But first, some Adjustments!
Quick bug fix!
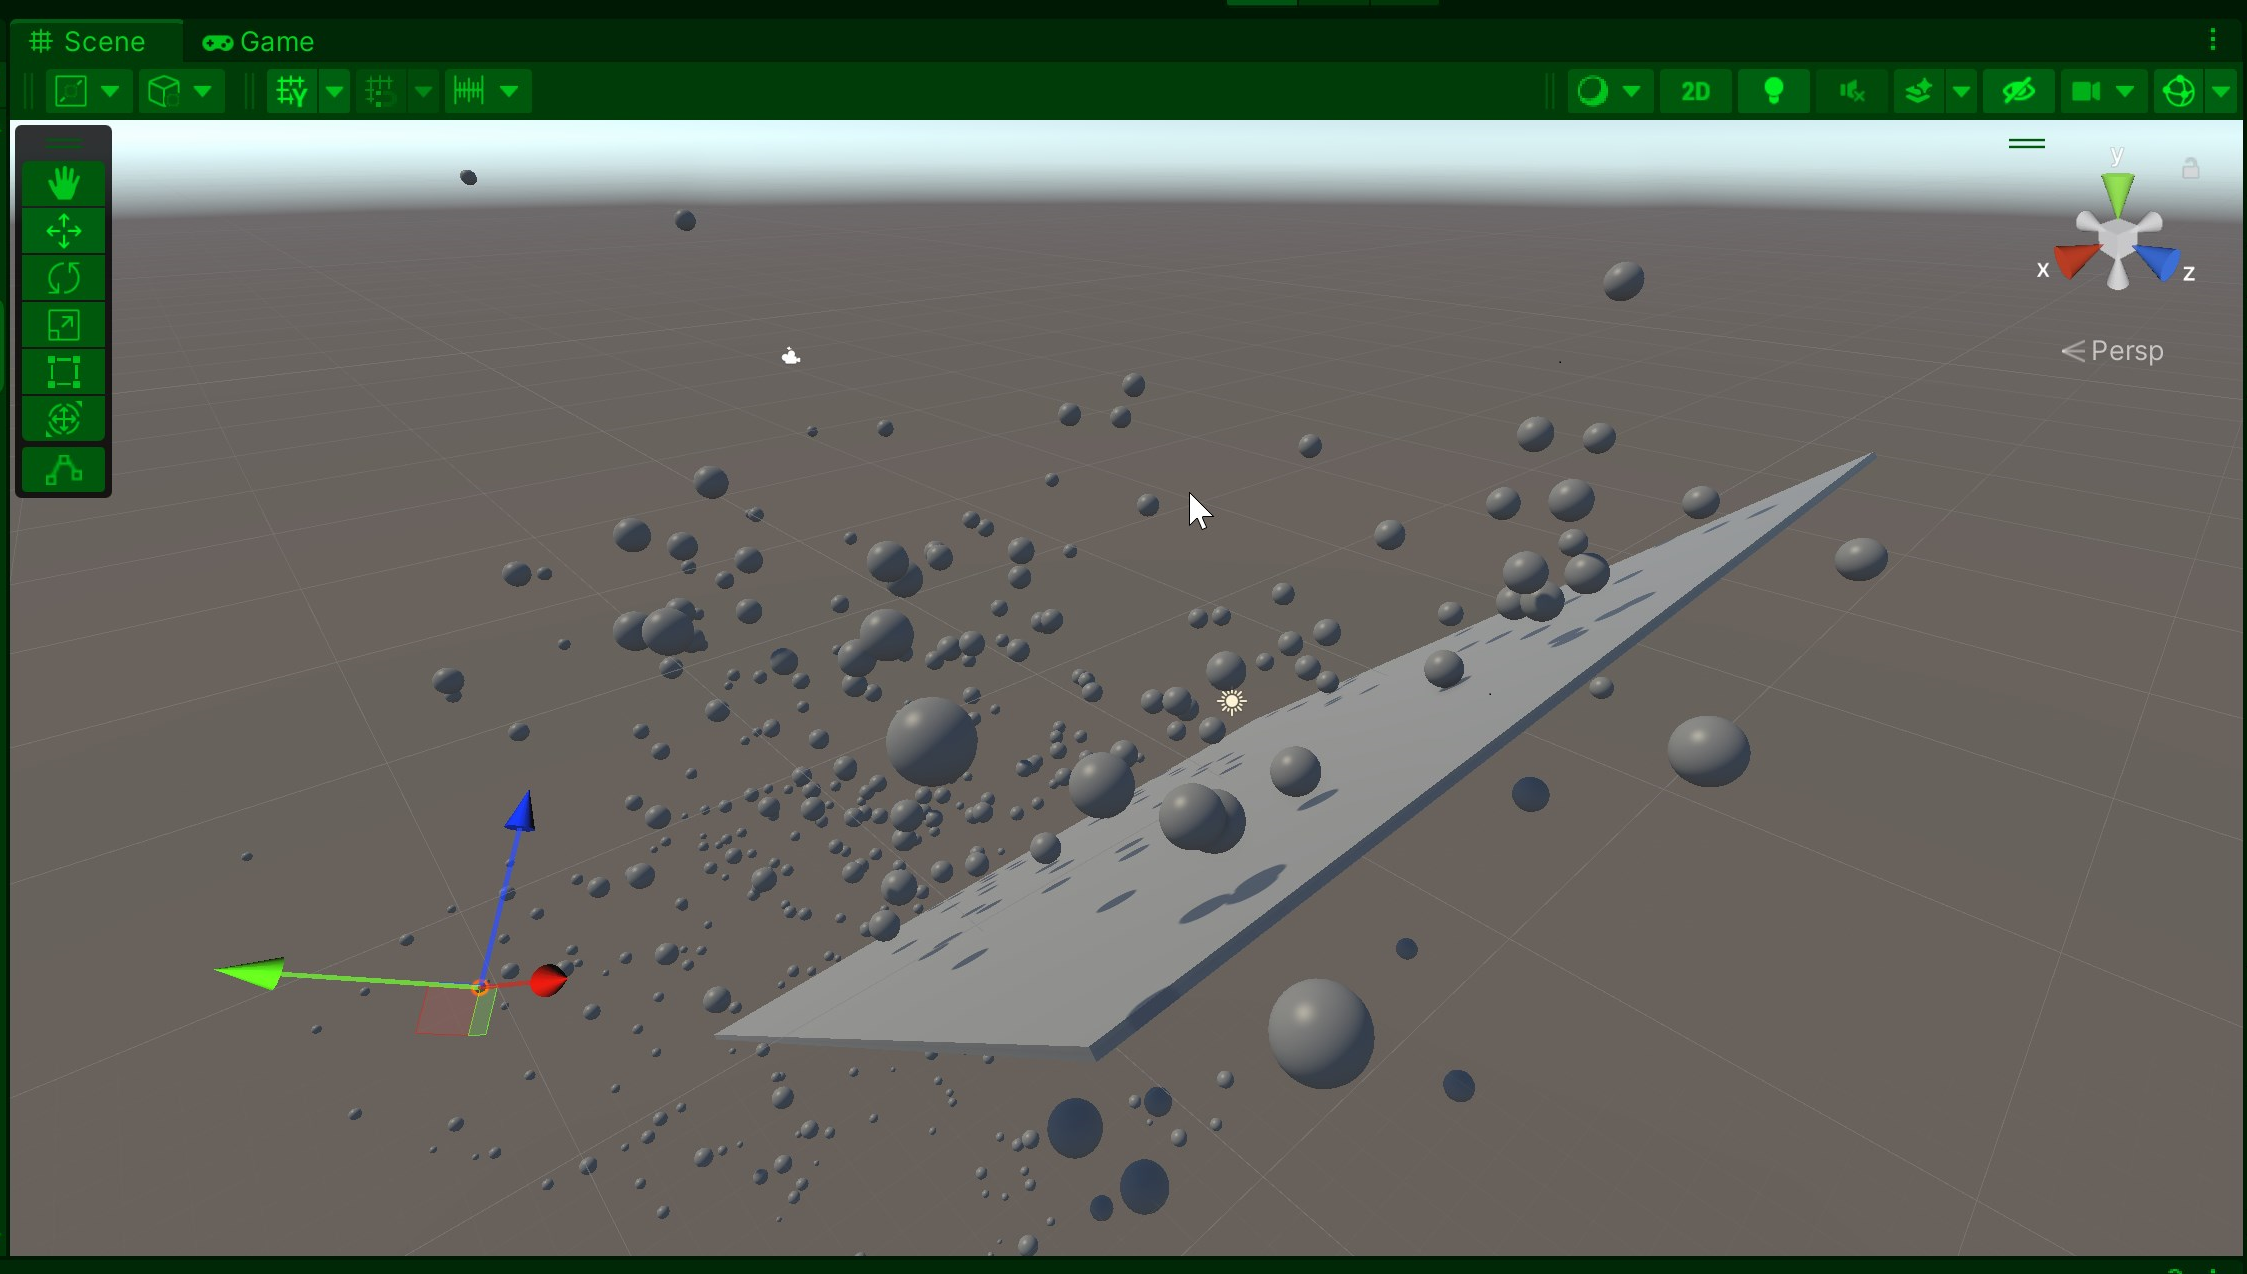
I noticed that when I played the scene the platform started slowly rotating 🤣🤣. Like, check this out:
We can easily fix this by applying a quick fix in our BouncingFloor object, by freezing the rotation in the platform, in the object's Rigidbody component:
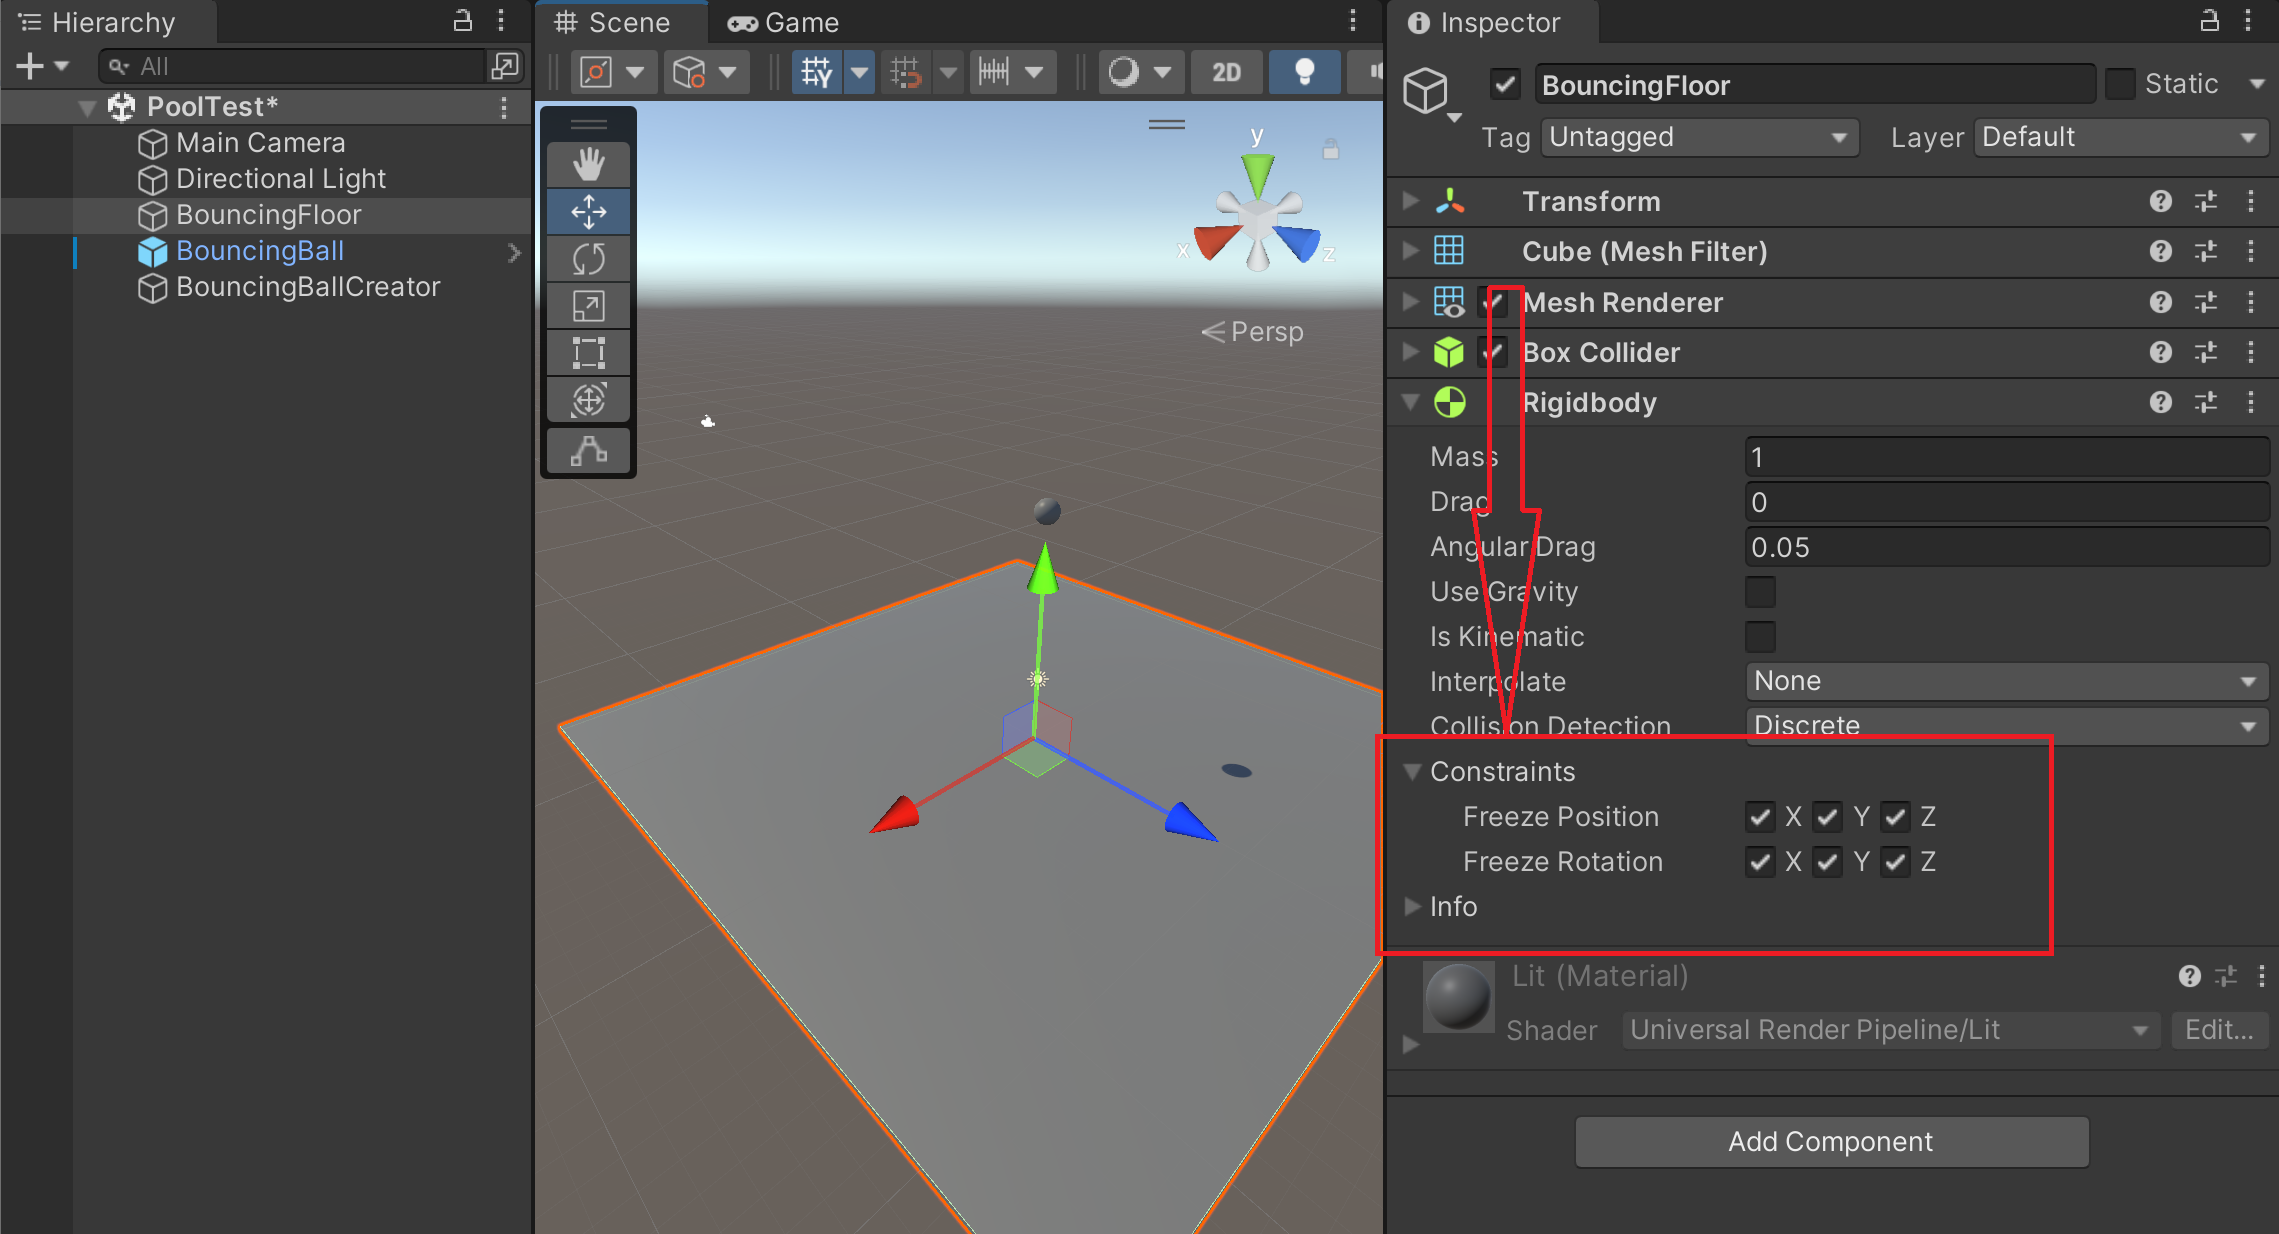
And with that simple adjustment, we can fix this issue. When you play the scene, the platform remains completely flat and still:
Adding some allocation weight
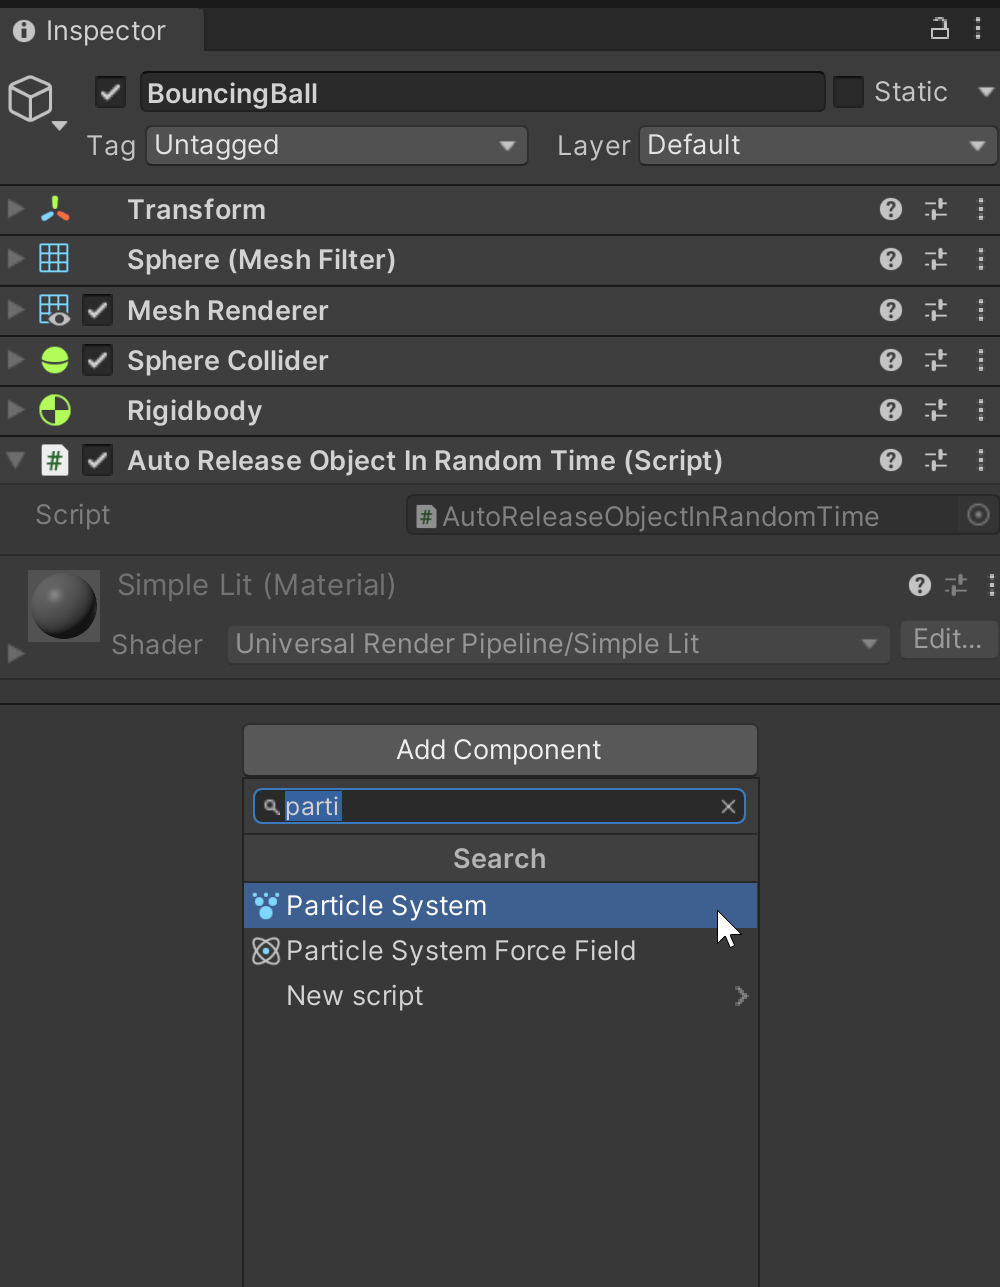
Open the BouncingBall prefab, and let's add a Particle System component to it. Particle systems can require a lot of memory, specially this component which stores all of the particle data on the CPU, as opposed to the VFX Graph which updates all of the particles on the GPU:
Group the Particles
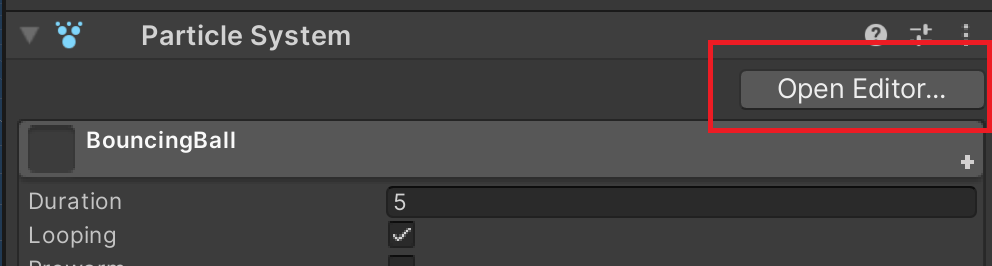
Let's go ahead and modify our particle system a bit, because it's too scattered, and just a bit too random. While still on the prefab editing mode of the BouncingBall prefab, select the particle system component, and open the editor:
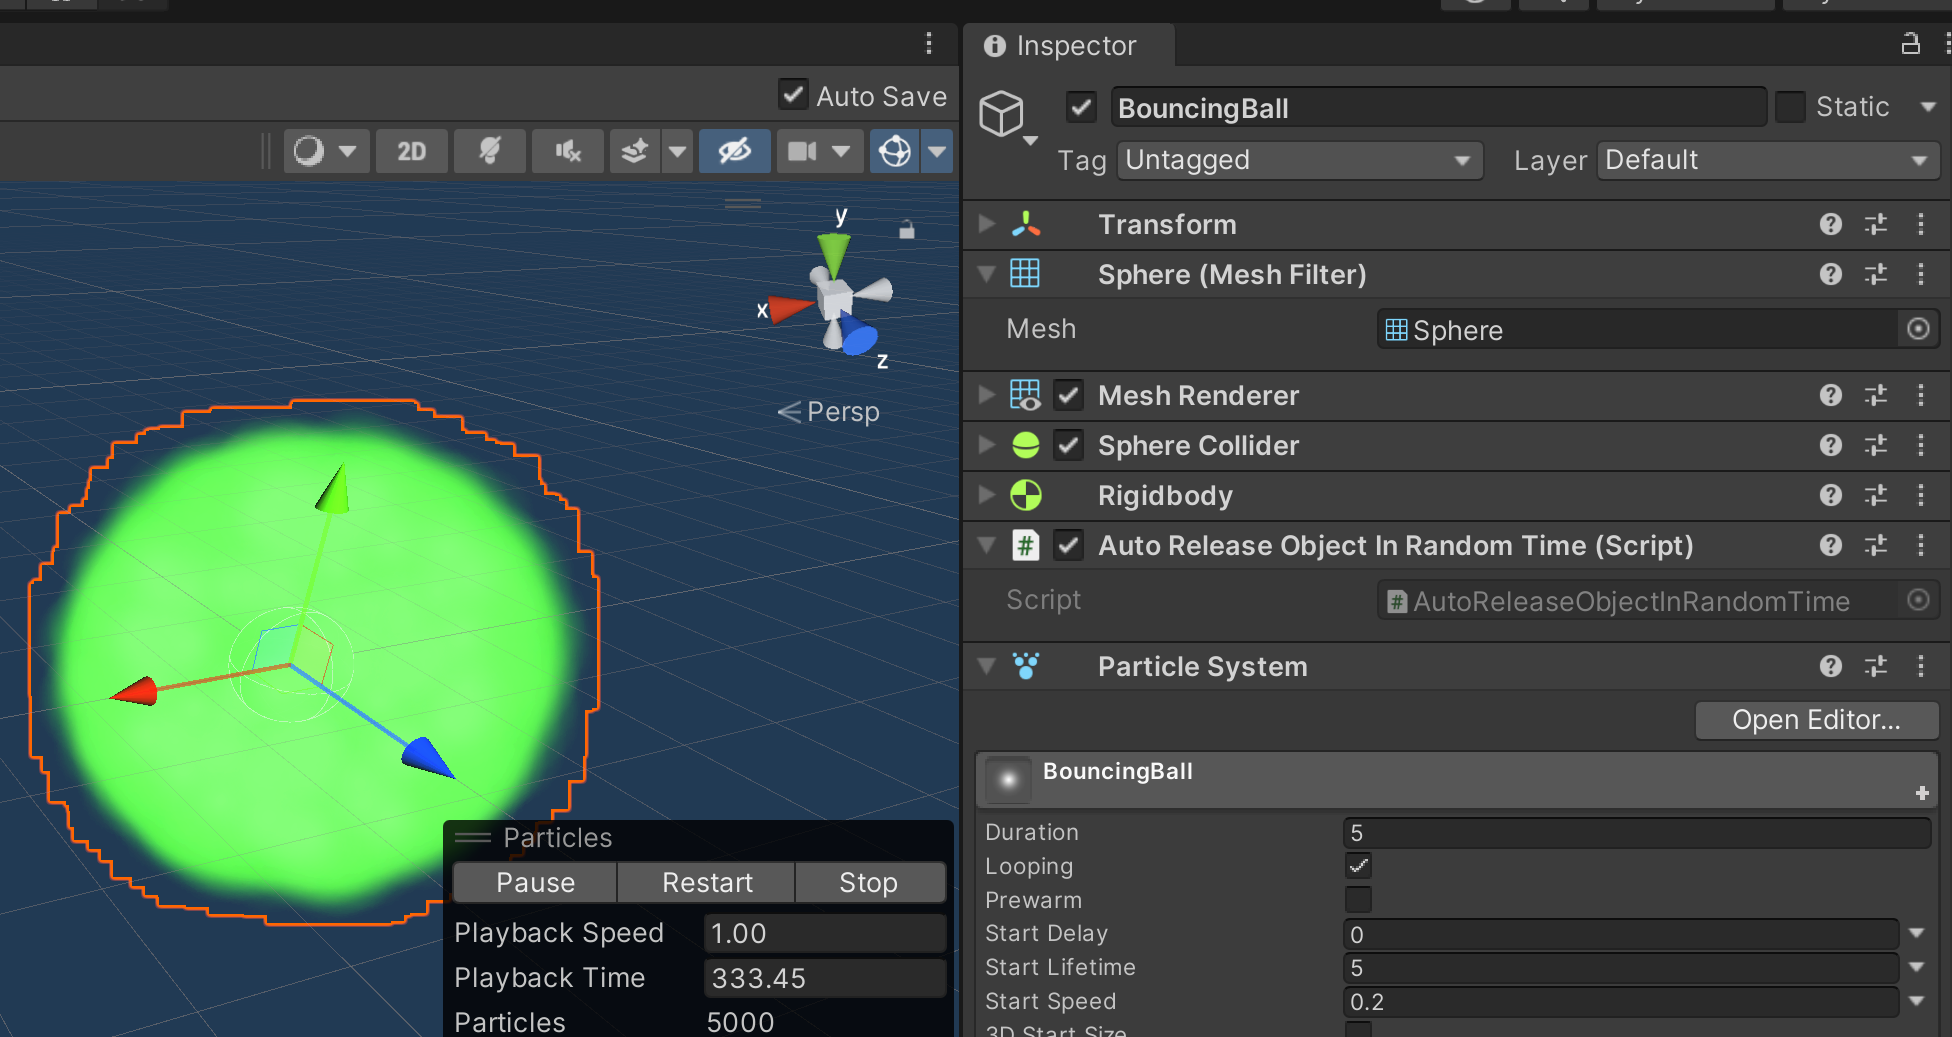
Now adjust these settings...
Main section:
Start Speed: 0.2Max Paricles: 5000- Optional...
Start Color: Whatever color you'd like
Enable the Emission section:
Rate Over TIme: 4000
Enable the Shape section:
Shape: Sphere
Renderer section:
Material: Default-ParticleSystem
Optional... Color over Lifetime:
- Choose any color variation you'd like
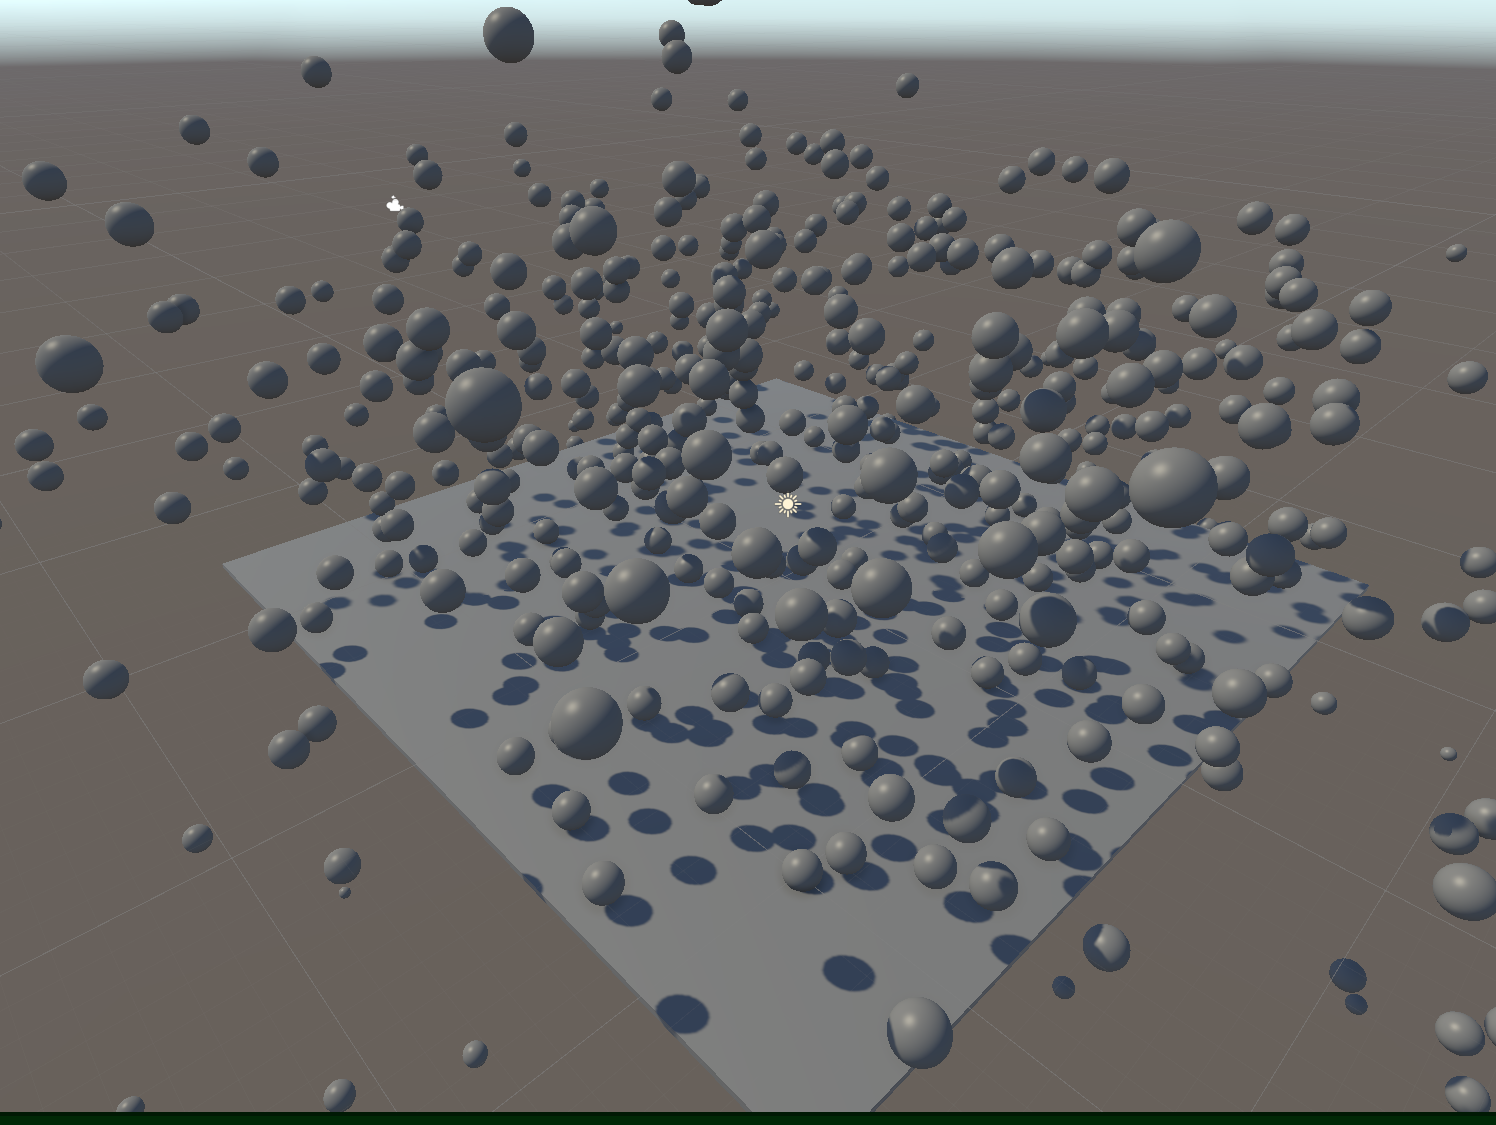
This will make your sphere look more like a blob:
Now when you're instantiating new bouncing balls in the regular way (no object pooling) it should take much longer.
Adding Some Test UI
Let's add a textbox to our screen:
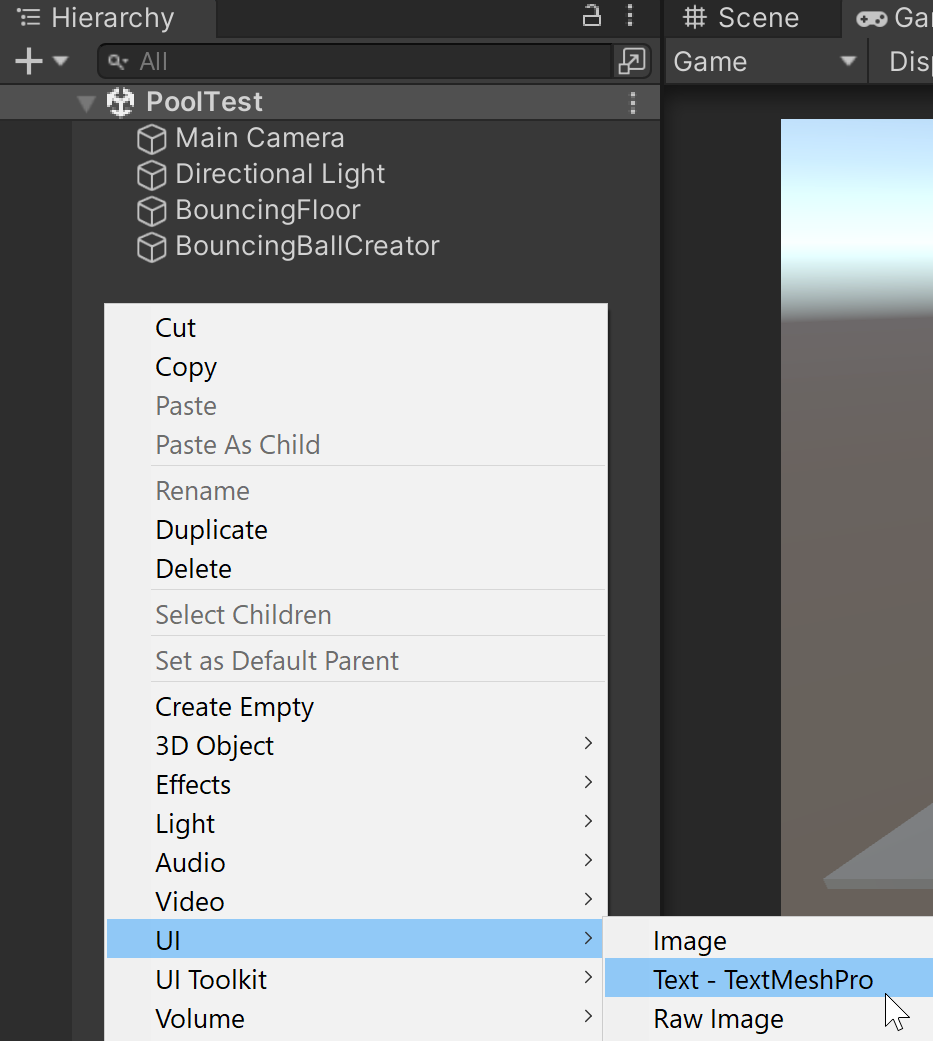
This will add the following GOs:
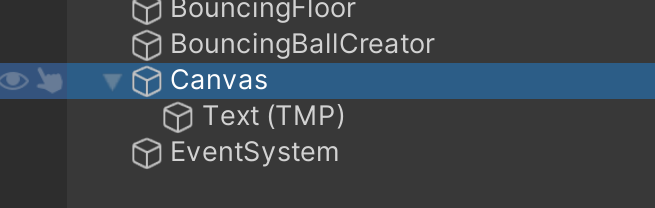
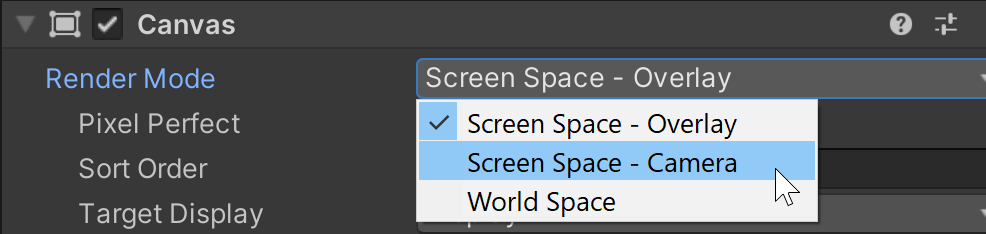
Head over to the Canvas object, and change the Render Mode:
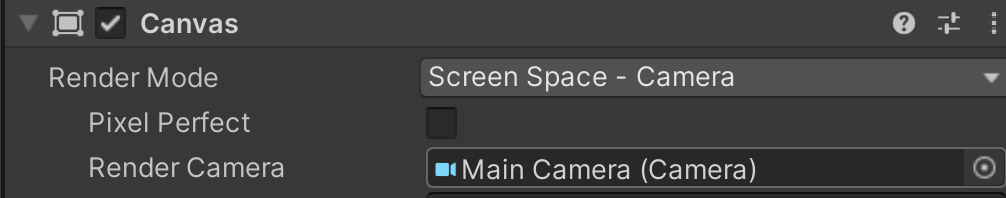
And once the render mode is changed, use the Main Camera game object from the scene hierarchy to fill in the Render Camera field:
Finally, change the Rect Transform of the Text (TMP) game object whose parent is Canvas:
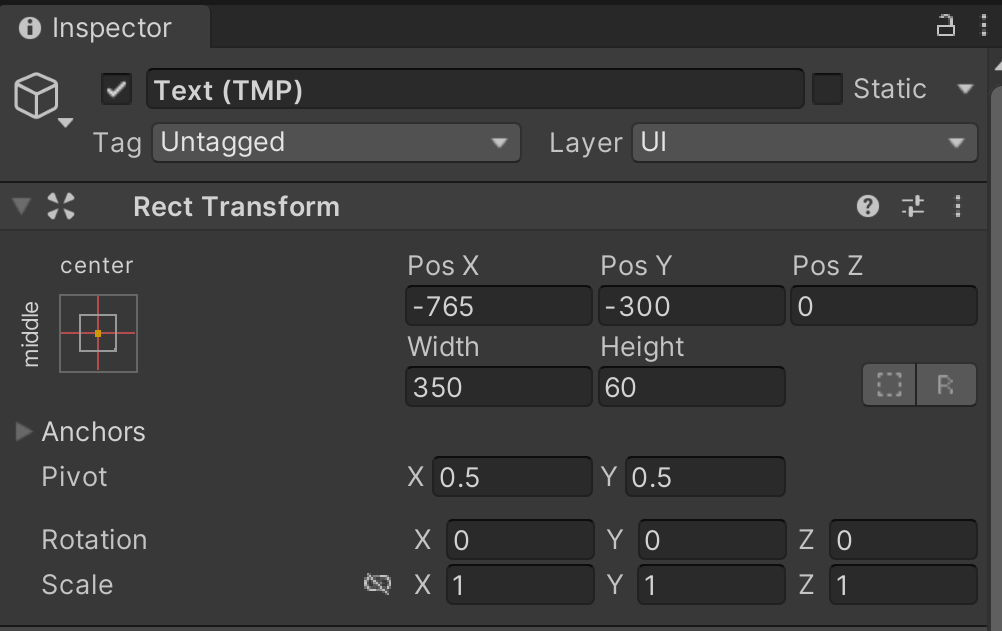
This will place the text on the lower
Connecting UI to code
In our PrefabInstantiator30by30 script, let's first add a new property to return how many instances the instantiator has created:
using UnityEngine;

[DisallowMultipleComponent]
public class PrefabInstantiator30by30 : MonoBehaviour
{
    ...

    [Range(50, 200)]
    public int instanceCount;

    public int instanceCountFromInstantiator => m_prefabInstantiator.objectsInstantiated;

    ...
}
Optional step: Change the
instanceCountrange to[Range(50, 200)].
And now, add a new script to our BouncingBallCreator called InstantiatorStatsText:
using UnityEngine;
using TMPro;

[RequireComponent(typeof(PrefabInstantiator30by30))]
public class InstantiatorStatsText : MonoBehaviour
{
    [SerializeField]
    private TMP_Text m_InstanceStatsTextMeshPro;

    private PrefabInstantiator30by30 m_prefabInstantiator30By30;

    private void Start()
    {
        m_prefabInstantiator30By30 = gameObject.GetComponent<PrefabInstantiator30by30>();
    }

    private void Update()
    {
        if (m_InstanceStatsTextMeshPro == null)
            return;

        m_InstanceStatsTextMeshPro.text = GetUpdateMessage();
    }

    private string GetUpdateMessage()
    {
        return $"{m_prefabInstantiator30By30.instanceCountFromInstantiator} " +
            $"out of {m_prefabInstantiator30By30.instanceCount} created";
    }
}
Note: This component requires the owning GO to also have a
PrefabInstantiator30by30component.
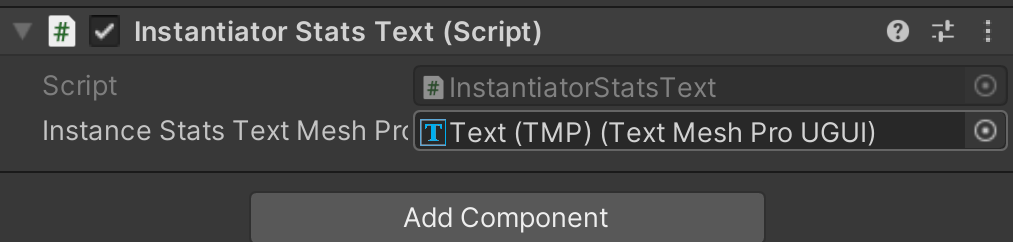
Finally, fill in the m_InstanceStatsTextMeshPro with the Text (TMP) game object. Otherwise, we'll get a null exception:
If everything is connected properly, it should display the current instance count and the current max amount of instances allowed:
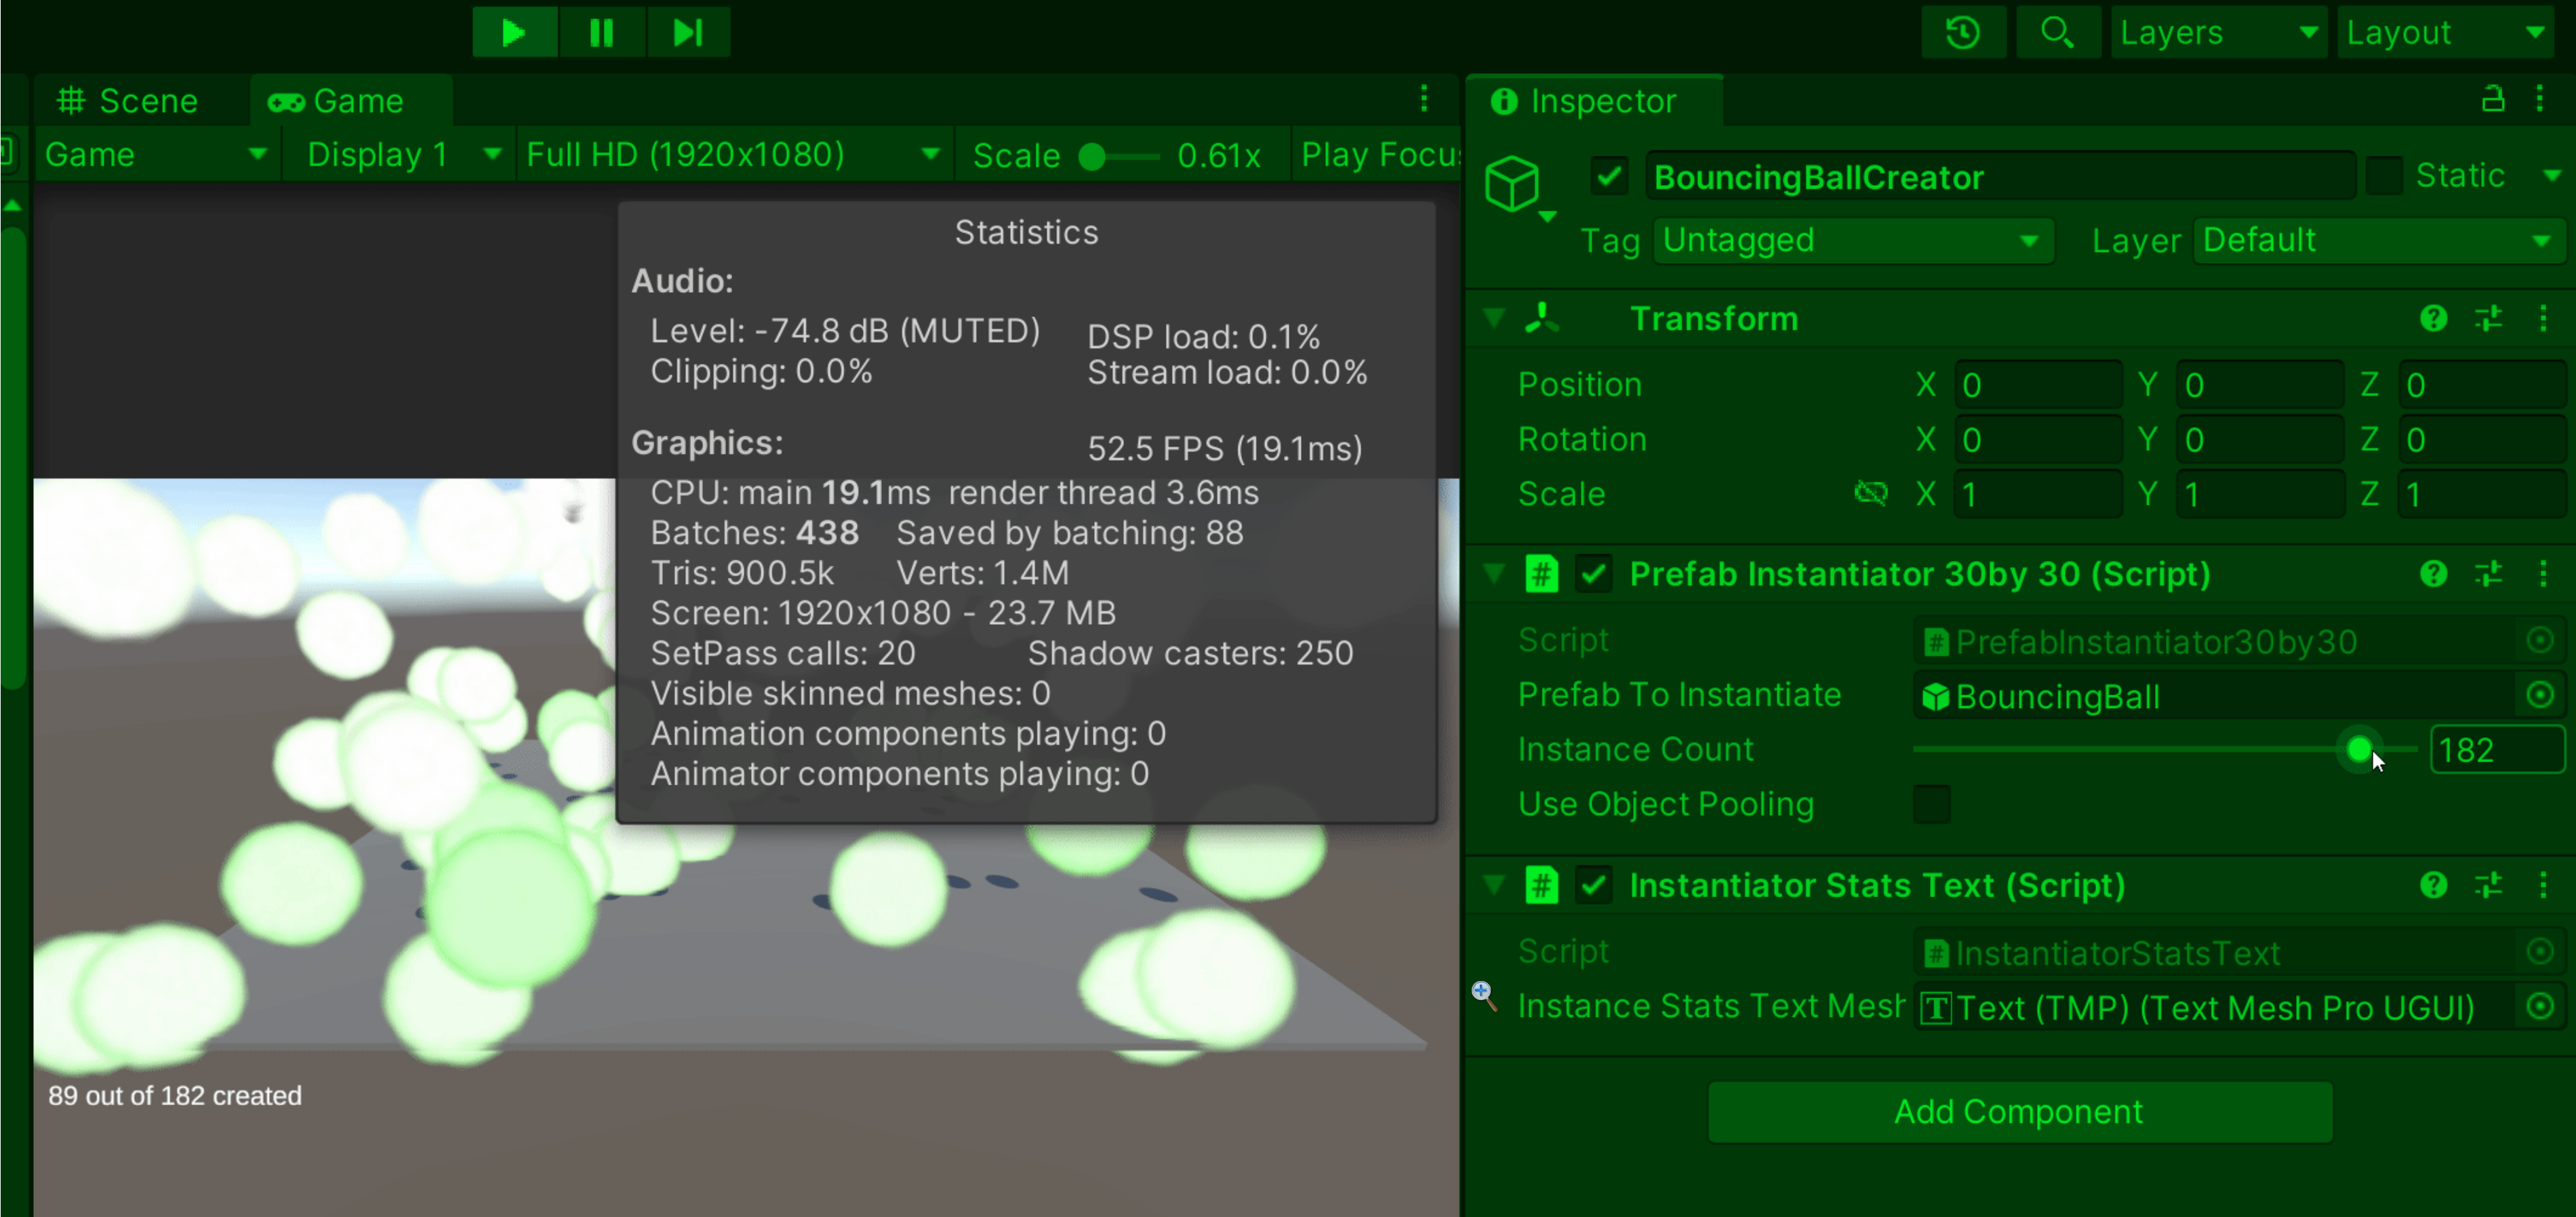
Note: Look at the lower-left corner...
Confirmed Suspicion
On the last article, I learned that Unity has a limit of game objects on scene. And this confirms it. If you notice, I reduced the amount of objects that you can create at run-time (max 200).
I asked around in my community of fellow developers, and I learned that in the end it depends on the hardware you're running your application. One dev recommended that I check out this cool experiment from La CreArthur where he compares physics simulations of many cubes in Unity GameObjects vs DOTS (Unity's Entity Component System solution).
As you can see from this experiment, you can place hundreds of GOs in one scene, but as part of the original scene structure. The cubes you see were never spawned at run-time. What this tells me is that the Unity engine potentially has a memory cap somewhere on run-time created GOs.
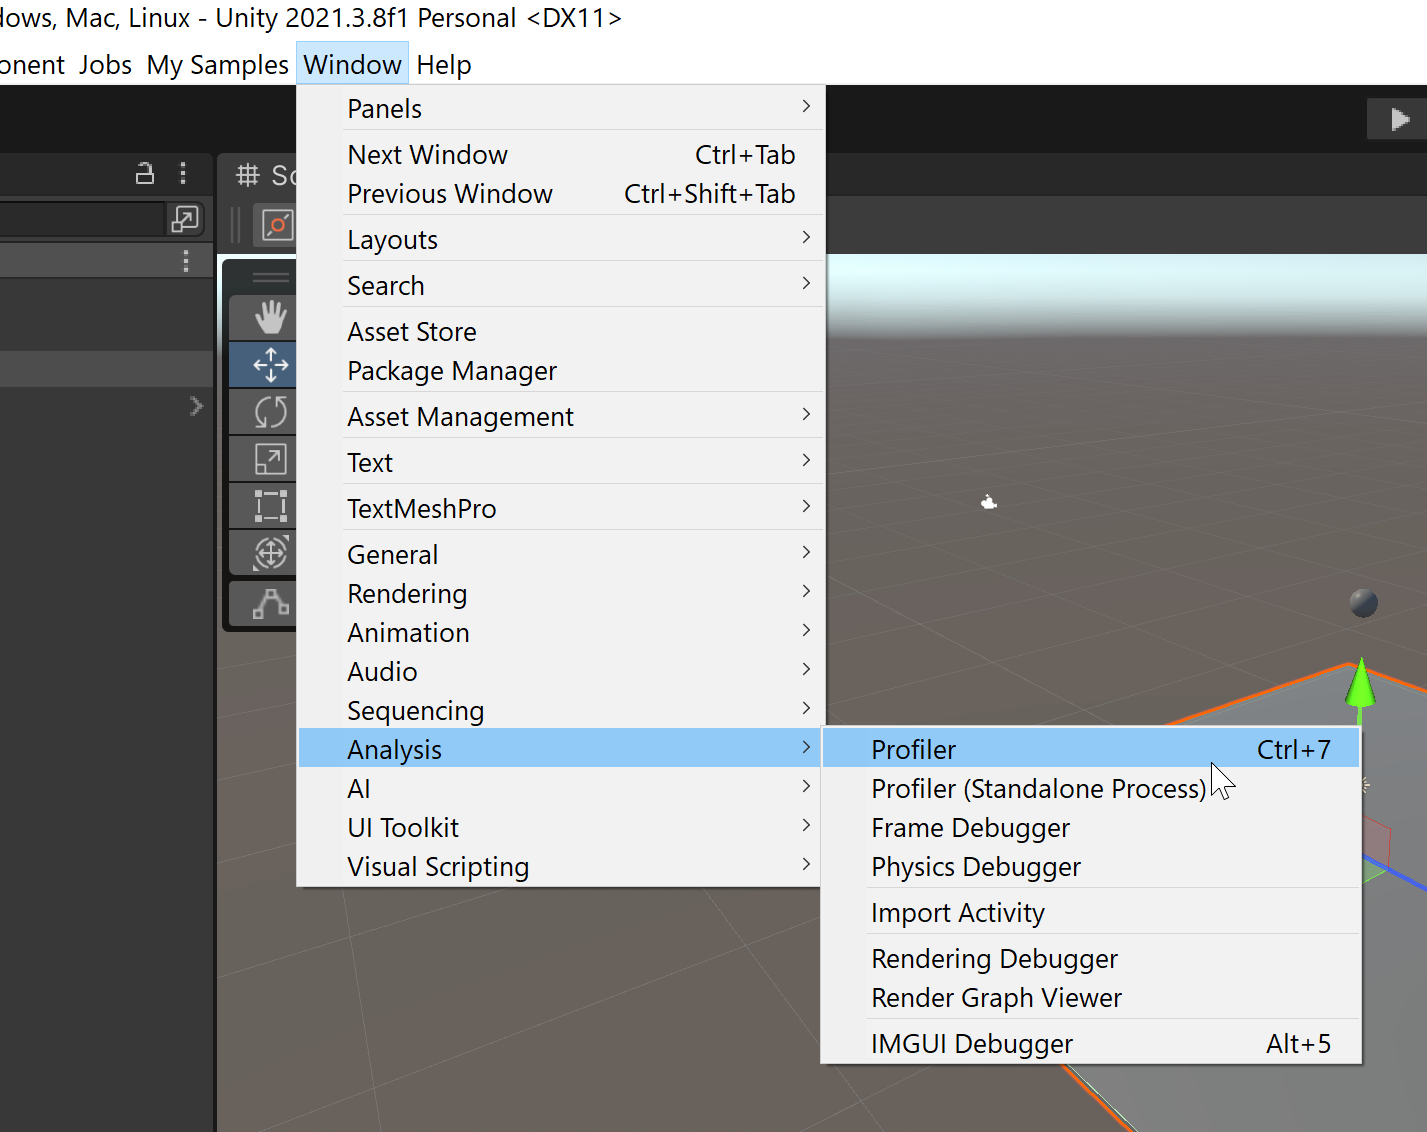
Using the profiler
Unity's performance profiler is a very powerful performance measuring tool, and quite easy to use. Open the profiler by clicking on Window > Analysis > Profiler:
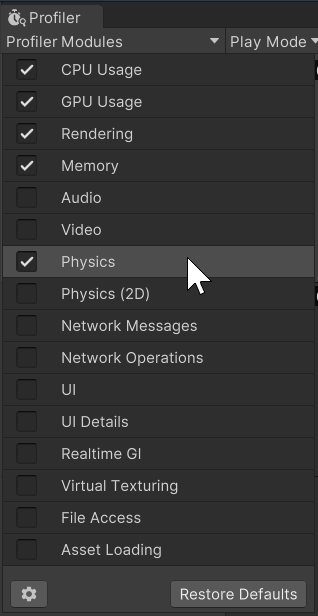
Once you open the window, let's modify which data to see. Click on the Profiler Modules dropdown, and only select the following categories:
Run the scene again with the profiler window open. Try it out with different settings on the PrefabInstantiator30by30 component owned by the BouncingBallCreator game object:
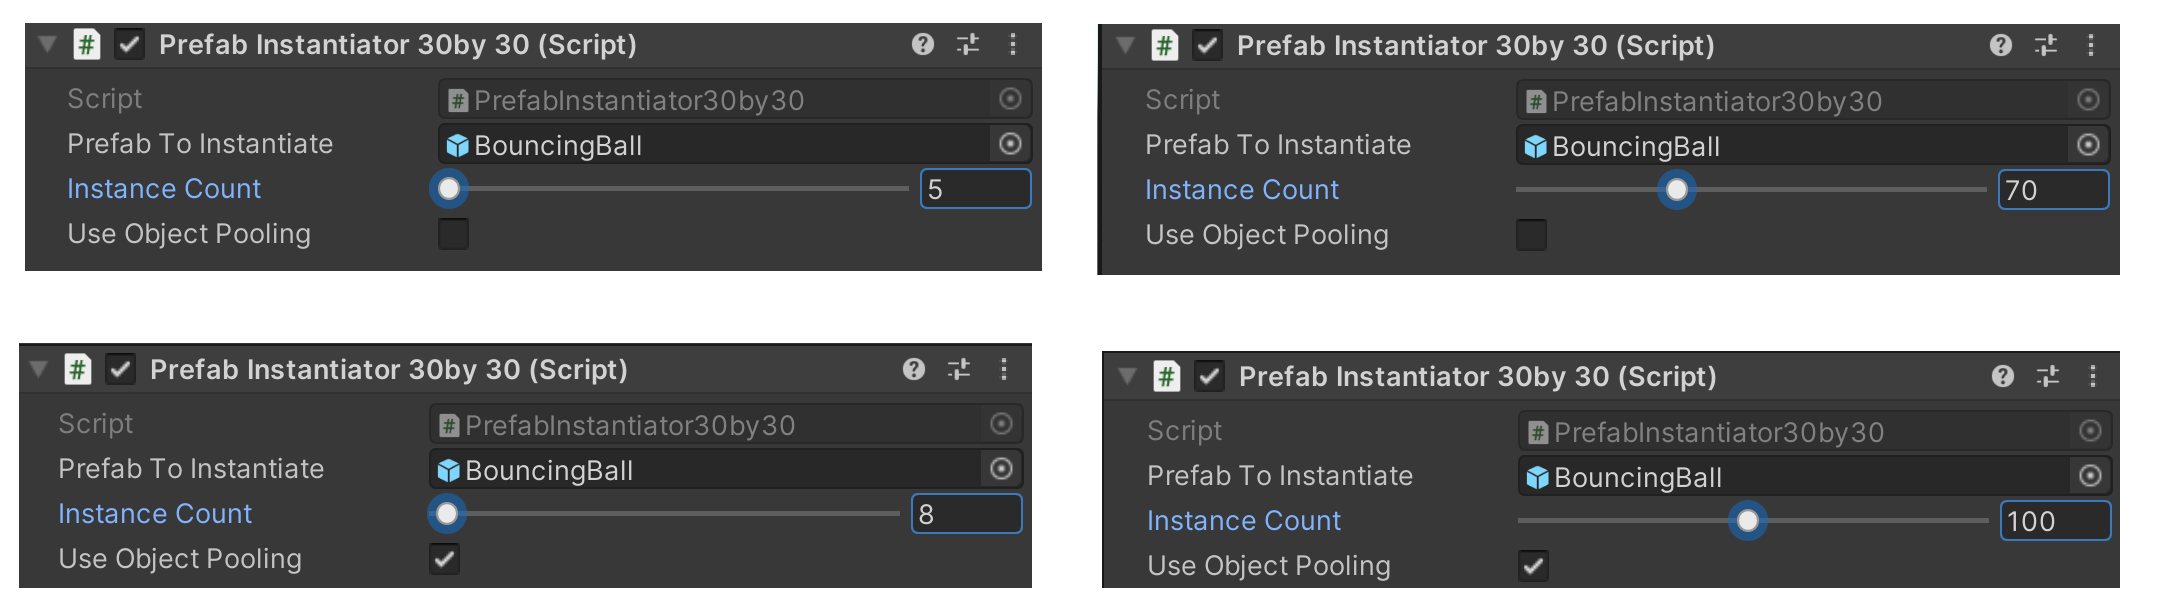
Note: When running the scene, change the amount of instances, but don't change the pooling checkbox! This script is very experimental, and I believe it'll behave very weirdly if you do. ⛔
Profiling Tests
Test 1 - No pooling
While having the profiler window open, run the scene with no object pooling, and just 5 instances to begin with. After the scene has run for some time, and still in play mode, quickly move the Instance Count from 5 to 60 or more:
You should get a giant spike in CPU Usage, Memory, Rendering, etc.:
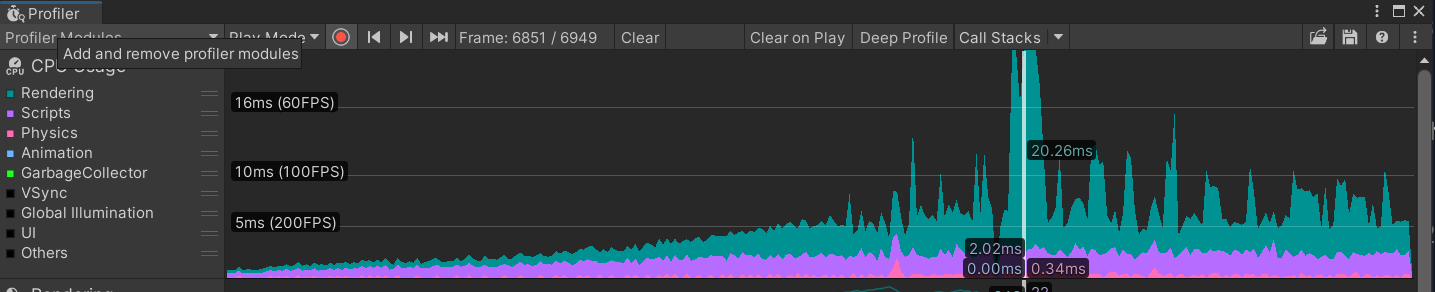
FPS REALLY DROPPING! This is due to all of the sudden instances being created very quickly.
Test 2 - With pooling
While having the profiler window open, run the scene with the object pool activated, and just 5 instances to begin with. After the scene has run for some time, and still in play mode, quickly move the Instance Count from 5 to 100 or more:
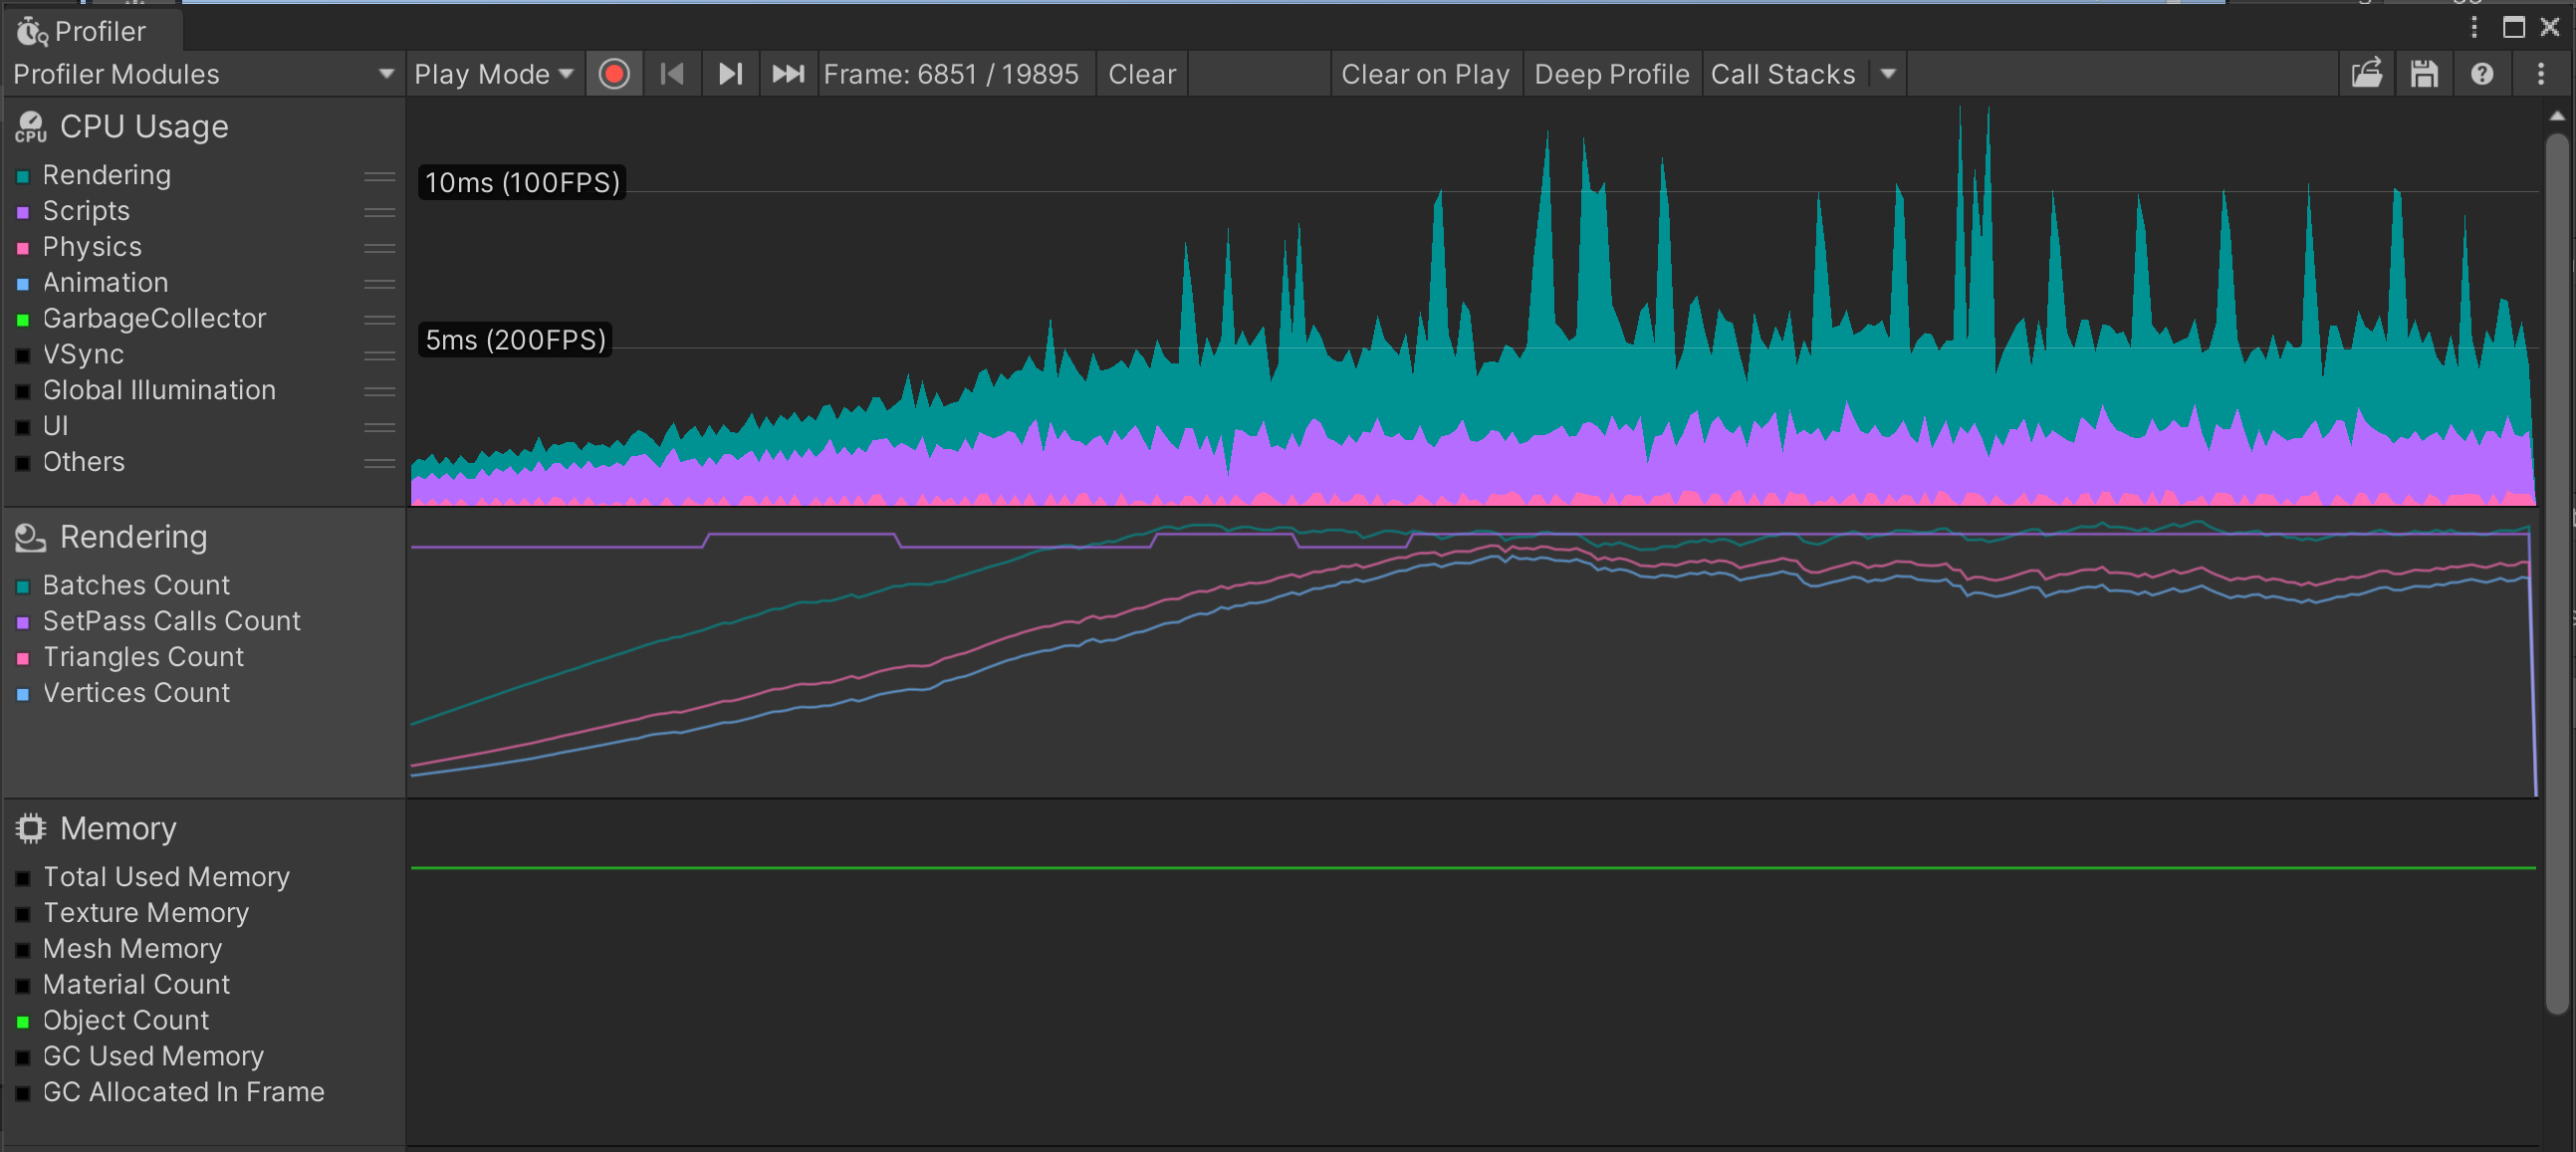
Compare the results from Test 1 and Test 2. In my screenshots, look at the sudden drop in framerates. In both tests there's a big drop, but if you look closely at Test 2, notice that it roughly remains at 100 FPS or more most of the time. In Test 1, the drop is to much lower than 60 FPS!
The downside of Test 2 is that since all of the objects are being pooled, the memory consumption is high, and stays that way until we release that internal memory!
Conclusion of Experiment
I will admit, that I winged this experiment a bit. I did know about the benefits of object pooling, but I've never experimented with Unity's own pooling classes.
Completed Goals
- Researched how to apply object pooling in Unity
- Created a basic object pool test scene
- Created basic, but functional object pooling code classes to test a high amount of allocations
- Compared performance and resource usage of the test scene with and without object pooling, by using the Unity profiler.
Lessons Learned from Experiment
- Unity handles physics collisions quite well with many objects on screen! 😀
- Confirmed that Unity has a limit of instantiated game objects on scene, but it seems to depend on the hardware ⛔
- Object pooling can definitely bring you run-time advantages, lowering the hit of FPS, but at the cost of much memory needed! 📝
Please let me know what you think!
- How differently would you have tested this?
- Would you still consider trying this out?
- What other stuff would you look for in the profiler?
🎉🎉🎉 Happy coding! 🎉🎉🎉


